30 Oct Shadow Wood at the Brooks Real Estate News | October 2023
As of October 1, 2023, there are 8 active listings in our area multiple listing service (MLS) in Shadow Wood. That is 1 more than last month.
For comparison, last year on Oct. 1, there were 4 listings in Shadow Wood.
There are 3 single-family homes on the market, listed from $975,000 to $3,400,000. The average list price is $2,174,967. The average days on the market is 99 days; the average total days on the market is 99 days.
In the condo market, there are 5 active listings ranging from $575,000 to $650,000. The average list price is $619,980. The average days on the market is 61 days; the average total days on the market is 97 days.
A reminder, you have access to the most comprehensive website devoted to Shadow Wood, www.ShadowWoodRealty.com. I’ve included maps, floor plans, photos, and descriptions of each neighborhood within this desirable community.
Please contact me for all your real estate needs in Shadow Wood. With over 35 years of helping buyers and sellers in SWFL, my experience will be invaluable in this fast-moving, low-inventory market.
Your Shadow Wood REALTOR®,
Ed Gongola
Summary of Shadow Wood Home Sales
If you are considering selling your Shadow Wood home, here are some statistics that may help you decide to place your home on the market.
SHADOW WOOD CONDOs
- Within the last 12 months, there were 22 sales; the average sales price was $644,859; and, these condos were on the market an average of 32 days; combined days on the market is 82.
- During the 12 months previous, there were 27 sales; the average sales price was $606,963; and, these homes were on the market an average of 13 days; combined days on the market is 65.
SINGLE-FAMILY SHADOW WOOD HOMES
- During the last 12 months, there were 37 sales; the average sales price was $1,666,203; and, these homes were on the market an average of 26 days; combined days on the market is 89.
- During the 12 months previous, there were 52 sales; the average sales price was $1,610,188 and, these homes were on the market an average of 11 days; combined days on the market is 64.
For a list of SHADOW WOOD homes sold in the last 12 months, click here.
For a list SHADOW WOOD homes that are pending at the moment, click here.
October 2023 Market Update

Buyers’ Tactics in the Face of High Mortgage Rates
By Holden Lewis
Buyers may be able to make rising mortgage rates less onerous by using one or more of these nine tips suggested by RE agents and lenders.

Mortgage rates have risen to their highest levels in more than 20 years, making it harder to afford a home. And yet, out of necessity or desire, hundreds of thousands of people buy homes every month.
With the 30-year fixed rate topping 7%, NerdWallet asked real estate agents and mortgage loan officers for advice on how homebuyers can stretch their home-buying dollars in this time of high interest rates. Here are nine tactics that they suggested.
1. Ask the seller to reduce the mortgage rate
Temporary mortgage rate buydowns have become commonplace since rates surged in early 2022. With a temporary rate buydown, the seller pays a portion of the buyer’s interest payments upfront. This reduces the house payments for the first one, two or three years of ownership.
“This is a common strategy for new-home builders, but it can also be used in the purchase of resale homes,” said John Bianchi, executive vice president for loanDepot. (All sources in this story commented via email.) “Negotiating a temporary buydown with the seller can help soften the blow of high interest rates, reducing your monthly payment for one to three years.”
In one typical setup, the seller’s payment effectively cuts the buyer’s interest rate by 2 percentage points in the first year, and by 1 percentage point in the second year. After that, the buyer pays the full interest rate. This is known as a 2-1 buydown.
Another option is to reduce the mortgage rate permanently, using discount points. One discount point equals 1% of the loan amount; each point typically reduces the interest rate by around 0.25 percentage point.
“Homebuyers have an opportunity to get a seller to pay for these methods to lower their interest rate,” said Chuck Vander Stelt, a real estate agent in Valparaiso, Indiana. “Some homebuyers should seriously consider offering a more generous price to the seller in exchange for a large closing cost concession and then use those funds to buy down the interest rate as much as possible.”
2. Use part of your down payment to pay down debt
When you apply for a mortgage, the lender considers your total debt payments for the house, car, student loans and credit cards. Sometimes it makes sense to divert some of your intended down payment money to cut the higher-rate debt first, said David Kuiper, vice president and senior mortgage banker for Dart Bank in western Michigan.
“While the mortgage payment will be slightly higher, the total debt/payments is lower, making the proposed purchase more affordable,” Kuiper said.
3. Use homebuyer assistance programs
State and local governments sponsor an abundance of programs to make homes affordable for homebuyers, especially first-timers. Some programs offer down payment assistance and help with closing costs. Others offer favorable interest rates or tax credits.
Details differ from state to state. Some programs are targeted to certain counties, cities or neighborhoods. Others are intended for specific groups of people, such as teachers, first responders or renters who live in public housing. Some programs have income limits.
4. Ask the seller to finance the purchase
You can give the seller an IOU for part of the home’s value and make monthly payments directly to the seller at an interest rate that’s lower than you could get from a bank. This arrangement is called “seller financing” and has its roots in the early 1980s, when mortgage rates zoomed as high as 18%.
You might wonder why a seller would agree to such a deal.
“They will often do this in order to get the price they want,” said Janie Coffey, who leads the Coffey Team with eXp Realty in St. Augustine, Florida. The seller gets full price while you get a break on the interest rate.
Seller financing usually has an end date: Within three, five or 10 years, the buyer must get a mortgage from a lender to pay off the amount owed to the seller. Coffey explained that the type of seller open to this arrangement often has paid off the mortgage “and is OK to wait for their big payoff.”
Seller financing is complex. Use an experienced real estate attorney to draw up the contract.
5. Don’t wait for a rate you like better
“If the right house comes along and the payment is affordable (even if you don’t like the interest rate), you should buy the house,” Kuiper said.
You often hear that you should buy now and refinance someday, after interest rates fall. That’s not Kuiper’s point. His point was this: If mortgage rates fall, more buyers will rush into the market. They’ll make competitive offers and drive home prices higher, “essentially wiping out any advantage of the lower interest rate.”
6. Don’t get distracted by things you don’t need
Some sellers want flexibility about the closing date, would prefer the buyer to make repairs, and are scared of accepting an offer from a buyer who ends up failing to qualify for the mortgage.
Vander Stelt advises staying focused on price with these hassle-avoidant sellers, while being flexible on the rest of the offer on the house. “Do this by offering the best terms you can, including buying the home as-is, a closing date and possession that works best for the seller, and illustrating how strong of a candidate you are to get your mortgage approved,” he said.
You can demonstrate that you’re a strong mortgage candidate by showing a preapproval letter and by sharing financial information, such as account balances that prove you have the cash for the down payment.
7. Buy a house that needs work
Buying a fixer-upper is an old-fashioned, time-tested way to save money.
“If you can be patient, it’s worth buying a home that needs work and slowly fixing it up over time or taking a renovation loan to acquire the home and do the work upfront,” said Brian Koss, regional sales director for Movement Mortgage, in Danvers, Massachusetts.
8. Build a house or buy a brand-new one
“Building a new home can provide more certainty around how long you will have to wait to move in, it can provide more cost certainty, and it can save you money in the short and long term by avoiding costly remodels, appliance repairs and unexpected repairs of older parts of the home,” said Jeffrey Ruben, president of WSFS Mortgage in the Greater Philadelphia area.
Buying a new home in a development has some of the same advantages. And today’s buyers have good reason to shop for new construction because there’s a shortage of existing homes for resale.
9. Rent out part of the house
Coffey suggested using an old strategy with a trendy name – house hacking – “buying a property like a duplex, where you live in one unit and rent out the other,” she said.
If you buy a duplex, triplex or quadplex, and you live in one unit, you can include the expected rental income for the others when qualifying for a loan. In some cases, you can qualify for a mortgage using expected rental income from an accessory dwelling unit, such as a basement apartment or a tiny house in the backyard.
If you buy a home today, you’re stuck with high mortgage rates for the time being. But by employing some creativity, you might find a way to afford homeownership.
© 2023 WBTW, Nexstar Broadcasting, Inc.
Market Resiliency Fuels Homoe Sales in August
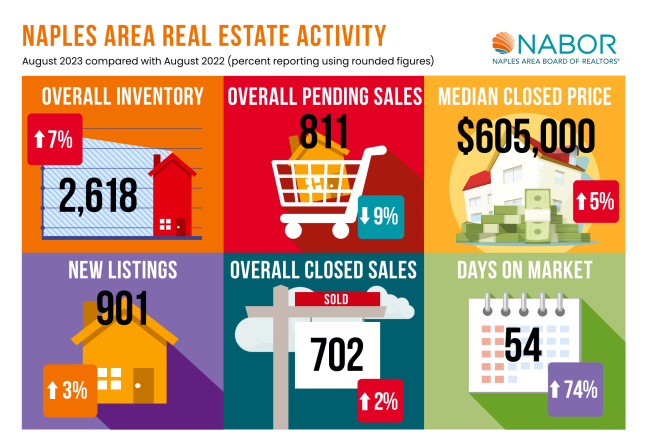
Inventory is selling quickly, and prices are stable in the Naples housing market. According to the August 2023 Market Report by the Naples Area Board of REALTORS® (NABOR®), which tracks home listings and sales within Collier County (excluding Marco Island), closed sales of homes in Naples during August increased 17 percent compared to July closed sales, and 1.9 percent to 702 closed sales from 689 closed sales in August 2022. Brokers who reviewed the Market Report are confident sales during the second half of 2023 could outperform sales during the second half of 2022, unless we experience another major disaster like a hurricane. Another promising factor that supports this expectation is the steady rate of new listings, which increased 2.6 percent in August, and contributed to the 7.2 percent increase in inventory for the month.
“I see the top of the last economic cycle occurring in the first quarter of 2022,” said Cindy Carroll of Carroll & Carroll Appraisers & Consultants, LLC. “This is when 18 months of rapid appreciation in most market sectors came to a halt. Historically, a period of correction follows a market peak. However, in most market areas, property values remain stable or have returned to our long-term historical trend of 8 percent per year appreciation. I am searching daily for evidence of wide-spread market decline but have yet to find it.”
The median closed price in August increased 5.2 percent to $605,000 from $575,000 in August 2022. Though according to the August report, activity in the condominium market fueled many of the increases reported. As such, there was a 7.7 percent increase in the median closed price in the condominium market compared to a 2.2 percent decrease in median closed price for the single-family home market; a 10.1 percent increase in new condominium listings compared to a 3 percent decrease in new single-family home listings; and a 25.5 percent increase in condominium inventory compared to a 3.7 percent decrease in single-family home inventory.
Typically, one of the slower months for activity, August’s showings decreased 19 percent to 21,269 showings from 26,191 showings in August 2022, which might also explain the 9.4 percent decrease in pending sales in August to 811 from 895 in August 2022.
“Days on market have been hovering around 50 since December 2022,” said Adam Vellano, a Naples Sales Manager at Compass Florida. “Before the pandemic, it was at 90-100 days.” For August, the report showed 54 days on market compared to 31 days on market in August 2022.
The NABOR® August 2023 Market Report provides comparisons of single-family home and condominium sales (via the Southwest Florida MLS), price ranges, and geographic segmentation and includes an overall market summary. NABOR® sales statistics are presented in chart format, including these overall (single-family and condominium) findings for 2023:
|

If you are looking to buy or sell a home in Naples, contact a Naples REALTOR® who has the experience and knowledge to provide an accurate market comparison or negotiate a sale. A REALTOR® can ensure your next purchase or sale in the Naples area is a success. Search for your dream home and find a Naples REALTOR® on Naplesarea.com.
The Naples Area Board of REALTORS® (NABOR®) is an established organization (Chartered in 1949) whose members have a positive and progressive impact on the Naples Community. NABOR® is a local board of REALTORS® and real estate professionals with a legacy of nearly 60 years serving 6,000 plus members. NABOR® is a member of the Florida Realtors and the National Association of REALTORS®, which is the largest association in the United States with more than 1.3 million members and over 1,400 local board of REALTORS® nationwide. NABOR® is structured to provide programs and services to its membership through various committees and the NABOR® Board of Directors, all of whose members are non-paid volunteers.
The term REALTOR® is a registered collective membership mark which identifies a real estate professional who is a member of the National Association of REALTORS® and who subscribe to its strict Code of Ethics.
|
|

|