|
|
Give Me A Call Today! (239) 770-0561
|
|
Bonita Bay Real Estate Newsletter
May | 2026
|
|
| Hello Ed!
As of May 1, 2026, there are 101 active listings in our area multiple listing service (MLS) in Bonita Bay; 9 less than last month.
For comparison, last year on May 1, there were 165 listings in Bonita Bay.
There are 23 single-family homes on the market from $750,000 to $6,750,000. The average list price is $2,836,870 and the average days on the market is 72. The combined days on the market is 90.
There are 43 listings in the carriage, mid-rise, townhouse, and attached villa market with prices ranging from $300,000 to $995,000. The average list price is $529,547 and the average days on the market is 99. The combined days on the market is 122.
In the high-rise market, there are 35 active listings in Bonita Bay ranging in price from $599,000 to $4,350,000. The average list price is $2,163,657 and the average days on the market is 98. The combined days on the market is 150.
A reminder, you have access to the most comprehensive website devoted to Bonita Bay, BonitaBayRealty.com. I’ve included maps, floor plans, photos, and descriptions of each neighborhood within this desirable community.
Please contact me for all your real estate needs in Bonita Bay. With almost 40 years of helping buyers and sellers in SWFL, my experience will be invaluable in this ever changing market.
Your Bonita Bay REALTOR®,
Ed Gongola |
|
Summary of Bonita Bay Home Sales
|
|
| If you are considering selling your Bonita Bay home, here are some statistics that may help you decide to place your home on the market.
BONITA BAY CARRIAGE, MID-RISE, TOWNHOUSE AND ATTACHED VILLA HOMES
- Within the last 12 months, there were 84 sales with an average sales price of $556,165; these condos were on the market an average of 117 days; combined days on the market is 188.
- During the 12 months previous, there were 70 sales with an average sales price of condominiums was $639,254; these homes were on the market for 94 days; combined days on the market is 159.
BONITA BAY HIGH-RISES
- During the last 12 months, there were 48 sales with an average sales price of $1,836,845; these homes were on the market an average of 138; combined days on the market is 197.
- During the 12 months previous, there were 37 sales with an average sales price of $2,235,903; these homes were on the market for an average of 111 days; combined days on the market is 170.
SINGLE-FAMILY BONITA BAY HOMES
- During the last 12 months, there were 63 sales with an average sales price of $1,765,278; these homes were on the market an average of 104 days; combined days on the market is 179.
- During the 12 months previous, there were 86 sales with an average sales price of $2,304,923; these homes were on the market for an average of 62 days; combined days on the market is 129.
For a list of BONITA BAY homes SOLD in the last 12 months, click here.
For a list of BONITA BAY homes that are PENDING at the moment, click here.
Meet Ed Gongola and discover how he can help you with his concierge-style of service when buying or selling your home. |
|
| Nearly four decades of expertise and relationship-driven service distinguish this market veteran.
Ed Gongola has been recognized as Downing-Frye Realty’s Top Agent in Bonita Springs for 2025, marking his second consecutive year earning this distinction. With nearly 40 years of real estate experience in Southwest Florida, Gongola’s achievement reflects a career built on deep community expertise, exceptional negotiation skills, and unwavering client loyalty. |
|
Ed Gongola Interview … Downing-Frye Agent of the Year
|
|
May 2026 Real Estate Market Update
|
|
| DOWNING-FRYE: PENDING SALES INCREASE IN MAY
“April was a very good month for Downing-Frye agents,” said Mike Hughes, General Manager for Downing- Frye Realty, Inc. “With the Iranian conflict and higher gas prices we were a little on edge, but the real estate market wasn’t. It roared ahead full steam! We had 183 pending sales in April 2026 which was a 25% increase over the previous April.
To date, Downing-Frye agents have had 663 closings. For the first four months of 2026, our Bonita office has seen an 83% increase in closings compared to the first four months of 2025. The Marco office has seen a 72% increase in closings and the Naples office is up slightly.
May is a month where we tend to prepare for the summer season. We are entering May with 915 listings. This listing base should be welcome news for our summer visitors!”
BONITA / ESTERO: INVENTORY INCREASES
In March, the Bonita Springs-Estero market showed resilient pricing despite a significant double-digit surge in active inventory. Single-family listings jumped 32.4% (642 vs. 485 last year), while condo listings surged 38.5% (896 vs. 647), providing the most buyer selection since the 2020 cycle. The median sales price for single-family homes was $665,000 (+10.8% YoY), and condos reached $445,000 (+1.1% YoY), suggesting that the value of local real estate remains high. A comparison of March 2026 vs. March 2025 shows a market transitioning from a seller’s peak into a more-balanced environment. The massive growth in months supply defines the 2026 spring season, with single-family inventory at a 7.2-month supply (4.9 months in March 2025) and condos at a 10.1-month-supply (6.5 months in March 2025).
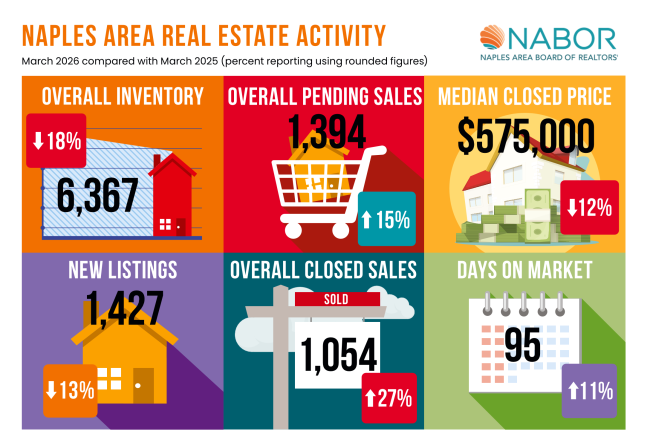
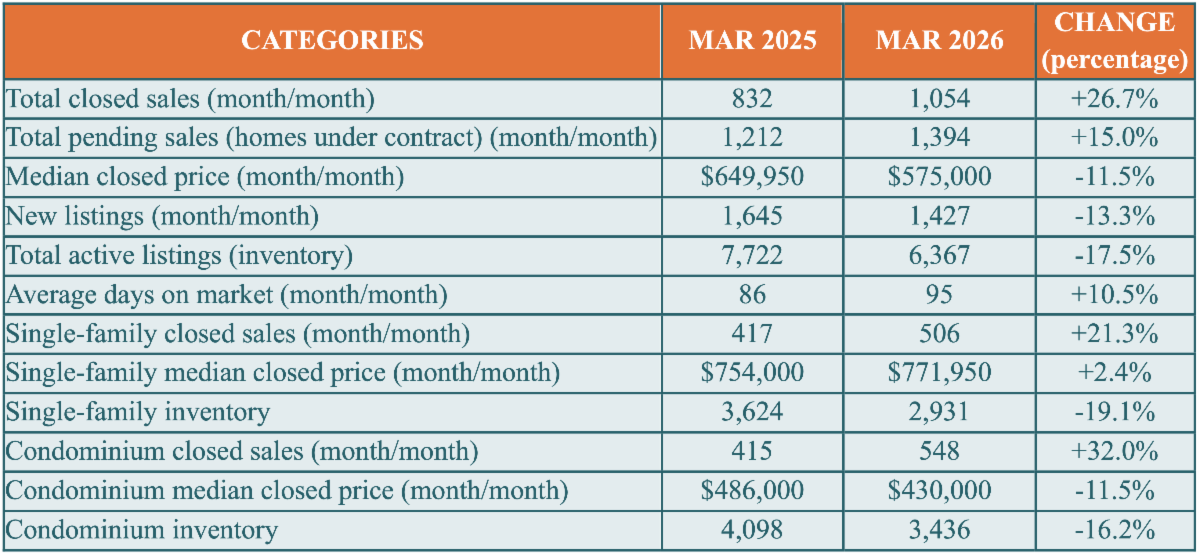
NAPLES AREA: BUYERS ARE ACTIVE
During March, overall pending sales increased 15% to 1,394 pending sales from 1,212 pending sales in March 2025, and overall closed sales increased 26.7% to 1,054 closed sales from 832 closed sales in March 2025, with both outperforming any March since 2016, with the exception of 2021 and 2022. Single- family closed sales were up 21.3% with a median closed price of $771,950 (up 2.4% over March 2025). Condo closed sales were up 32% with a median closed price of $430,000 (down 11.5% from March 2025). Single-family inventory was down 19.1% and condo inventory was down 16.2% for a total listing inventory of 6,367 properties (down 17.5% from March 2025). It took an average of 95 days to sell a property, which is a 10.5% increase from March 2025. Improved sales in the resale market have been paving a path for home builders again, with many builders offering incentives such as lower mortgage interest rates.
MARCO ISLAND AREA: INVENTORY DOWN
The Marco Island Area Assoc. of Realtors® reported March 2026 figures as compared to March 2025: Inventory was down 27% to 591 properties for sale; the number of properties sold was up by 21%; the average days on market was 89 days, and the dollar volume sold was $157M, up 16% from the year before. In March, the median sales price for homes was $1.5M, for condos was $610K and for lots was $3.5M.
FLORIDA: POSITIVE TRENDS
Closed sales of single-family homes in Florida were up year over year for the seventh consecutive month in March, rising by close to 6%, while closed sales of condos and Townhomes were up by 12%, which completed a strong first quarter with sales up 9% year over year for the three month period. Single-family inventory remains down from a year ago by over 10.5%, and new listings for condos and townhouses were down by over 13%, leading to a more than 11% year over year decline. The median price for closed single-family home sales in March was up by a little less than 2% year over year to $420,000 and the median price for closed condo and townhouse sales in March was unchanged compared to a year ago, remaining at $315,000. The largest number of sales were in the 300 to $400,000 range. Additionally, the $1 million luxury market was up by just over 14%.
USA: PENDING SALES INCREASE
Pending home sales in March increased by 1.5% from the prior month and declined 1.1% year over year. “Contract signings rose in March despite higher mortgage rates, pointing to pent-up housing demand,” said NAR Chief Economist Dr. Lawrence Yun. “A greater supply of inventory will help translate that demand into more home sales.”
Sources: The Bonita Springs-Estero REALTORS®/SWFLMLS, Naples Area Board of REALTORS®, Marco Island Area Assoc. of REALTORS. If your property is currently listed with another broker, this is not a solicitation of that listing. National Assoc. of REALTORS®, Florida REALTORS® ©2009 Design by Downing-Frye-Marketing, powered by Naples Media Group, Inc.
|
|
Equity-Rich Baby Boomers Driving Housing Market
By Melissa Dittmann Tracey
A new NAR report shows first-time buyers at record lows as Gen Z gains ground. Agents are playing a central role in transactions across all age groups.
|
|
|
Adults ages 61 to 79 continue to dominate the housing market, making up the largest group of home buyers and sellers, according to the National Association of Realtors®’ newly released 2026 Home Buyers and Sellers Generational Trends report.
One thing they all have in common: trusting a real estate professional throughout their housing transaction. NAR reports 88% of all buyers purchased their homes through a real estate agent, while 91% of sellers worked with an agent.
Last year, baby boomers overtook millennials – the largest U.S. population – to become the biggest force of home buyers and sellers, proving to be a powerful backbone to the housing market. Their soaring home equity from decades of ownership may be freeing them to be more agile than other age groups who are struggling to afford higher home prices.
Baby boomers accounted for 42% of buyers and 55% of all home sellers – the highest of any other age group, according to NAR’s 2026 report.
“The housing market remains sharply divided between homeowners with equity and first-time buyers trying to break in – many of whom are younger millennials,” says Jessica Lautz, NAR’s deputy chief economist. “For many younger households, affordability challenges and limited inventory are still making homeownership difficult to achieve.”
The breakdown of home buyers, according to NAR’s 2026 Home Buyers and Sellers Generational Trends report:
- Baby boomers (1946–1964; ages 61 to 79): 42% (unchanged from last year)
- Millennials (1980–1998; ages 27 to 45): 26% (down from 29% last year)
- Gen X (1965–1979; ages 46 to 60): 25% (up from 24% in 2025)
- Gen Z (1999–2011; ages 18 to 26): 4% (up from 3% last year)
- Silent Generation (1925–1945; ages 80 to 100): 4% (unchanged from last year)
First-time buyers have fallen to their lowest share on record, comprising 21% of buyers over the last year, according to NAR’s records dating back to 1981. First-time buyers tend to largely be made up of millennials, those born between 1980 and 1998. Last year, NAR’s 2025 Profile of Home Buyers and Sellers report showed that the median age of first-time buyers climbed to a record high of 40 years old – up from the late 20s in the 1980s.
That said, Lautz recently told Real Estate Today that there may be openings gradually arising for more first-time buyers to get into the market. In March, they accounted for 32% of recent buyers, according to the March 2026 Realtor® Confidence Index survey.
“We know that first-time home buyers have struggled over the last several years … but they have had slightly better opportunities this winter because mortgage rates ticked down and they saw more inventory than they did last year at this time,” Lautz says. “We know there’s a huge pipeline of young adults who have been waiting on the sidelines for many years, and they want to purchase their first home. That pent-up demand is there.”
Equity is Helping to Make Moves Happen
For current homeowners, they’re seeing equity soar, particularly among those who’ve owned their homes the longest. For example, older baby boomers – ages 71 to 79 – have the longest home tenure with a median of 15 years before selling, according to NAR’s latest report. That lengthier timeline when staying in one home has allowed them to ride the wave of higher home prices.
For example, NAR recently reported that the median existing-home sales price for March was the highest ever recorded for that month – reaching $408,800. That price growth has helped the typical homeowner accumulate $128,100 in housing wealth over the past six years alone. For baby boomers – who’ve held their homes more than double that timeframe – the appreciation is much higher.
“Baby boomers are at a point in life when they have the flexibility to move, often with housing equity to purchase their next home,” Lautz says. “In earlier days, baby boomers – like millennials today – may have moved because of a job change or the need for a larger home. Today, many baby boomers are embracing choice and moving to be closer to family and friends, to downsize or to retire and enjoy a work-free lifestyle.”
That said, older millennials – ages 36 to 45 – also are leveraging home equity to become move-up buyers. They’ve comprised 15% of the homebuying share but tend to have the highest median household incomes of any other generation at $132,700. They often tend to purchase the largest homes (at a median of 2,100 square feet).
“Older millennial buyers are now entering middle age, and with that comes with a shift,” Lautz says. “This cohort is now the highest-earning generation of home buyers, buys the largest homes and is most likely to have children living with them. Those traits were once more commonly associated with Gen X buyers, who are now increasingly looking toward empty-nesting and retirement.”
Housing’s Attention Turns to Gen-Z
Gen Z is starting to make its mark on the housing market, albeit still representing a small share of buyers, at 4%, and sellers, at 2%. But notably, “they are entering homeownership with the lowest household incomes and are unlikely to be married yet or to have children living in their home,” the NAR report notes.
They’re shunning traditional norms. Thirty-five percent of Gen Z buyers were single females – the highest share among all age groups. Seventeen percent of Gen Z buyers were unmarried couples, also the highest share among all generations.
“What stands out about Gen-Z is how confidently they’re beginning to define homeownership for themselves,” Lautz says. “They may still be a small share of the market, but they’re already challenging old assumptions about who buys a home and when. For many of these buyers, marriage and children are no longer the defining milestones before a home purchase. The driving force is simply the desire to own a home of their own.”
Other Trends to Watch
Additional findings that emerged from NAR’s 2026 Home Buyers and Sellers Generational Trends report include:
- Multigenerational living options: Fourteen percent of buyers purchased a multigenerational home, down from 17% last year. Gen X, ages 46 to 60, purchased the highest share of multigenerational homes at 19%. The top motivations for combining households among all age groups were to care for aging parents, for cost savings and because adult children were moving back home.
- Single female force: Females are increasingly buying solo – making up a growing share of the homebuying market. “They’re really making a lot of sacrifices to get into homeownership – and that says to me, it’s important to her,” Lautz says. “She wants to be a homeowner.” Indeed, single females accounted for 25% of recent home buyers – second to only married couples at 50%. Only 11% of buyers were single males. The highest percentage of single female buyers was among Gen Z at 35%.
- Down payment help: As home prices have surged, more first-time buyers are looking for help with the down payment. About a quarter – or 26% – of younger millennials received down payment help in the form of a gift or loan from a friend or relative. Millennials, in general, may increasingly turn to help due to their high amounts of debt, notably from student loans. About 40% of younger millennials reported student loan debt, with a median balance of $30,000, as well as 27% of older millennials with a median balance of $40,000.
- Real estate agent reliance: Regardless of age, most buyers start their house hunt online, but they cite real estate agents as their most-used information source. Younger buyers usually seek help in understanding the purchase process, whereas older buyers tend to most appreciate agents who point out unnoticed features and faults with a property.
Overall, among all age groups, home buyers and sellers value real estate agents’ negotiation skills, list of service providers and help in improving the buyer’s knowledge of search areas for homes.
© 2026 National Association of Realtors® (NAR) |
|
|
Home Sales in March Highlight Market Strength
Brisk pending and closed sales activity in the Naples housing market during March (+15 percent and +26.7 percent, respectively) signal improved market conditions and confidence. Sellers who priced properties competitively for today’s market or were open to negotiation – especially in the condominium market – enjoyed swift sales in March.
|
|
| Broker analysts reviewing the March 2026 Market Report by the Naples Area Board of REALTORS® (NABOR®), which tracks home listings and sales within Collier County (excluding Marco Island), are confident price corrections that began last summer helped to accelerate the market’s momentum during Q1 2026 and anticipate strong home sales into Q2.
Values Hold Steady
As illustrated during the 2025 Year-End Housing Market Conference by 2025 REALTOR® of the Year Jeff Jones, Broker at Keller Williams Naples, the median closed price in Naples increased 79 percent between 2019 and 2025. “People were paying over market value during 2022 and 2023 because the rush of sales during the pandemic diminished inventory. But the market has self-corrected, with list prices down about 8 to 10 percent since the peak. Inventory is back to a healthy level too.”
“Pending sales in the first quarter of 2026 are 48 percent above pending sales during the first quarter of 2019,” said Mike Hughes, Vice President and General Manager for Downing-Frye Realty, Inc. “Season doesn’t stop at Easter anymore. Buyers today are taking their time to find a home that fits their lifestyle needs.”
Overall pending sales increased 15 percent to 1,394 pending sales from 1,212 pending sales in March 2025. Overall closed sales increased 26.7 percent to 1,054 closed sales from 832 closed sales in March 2025. Both pending and closed sales activity during March outperformed activity in any March since 2016, with the exception of 2021 and 2022.
Overall median closed price decreased 11.5 percent to $575,000 from $649,950 in March 2025. The median closed price in the single-family home market increased 2.4 percent to $771,950 from $754,000 in March 2025. Conversely, the median closed price in the condominium market decreased 11.5 percent to $430,000 from $486,000 in March 2025.
“The condominium market was struggling to find its footing after the onset of the mandatory inspections and reserve studies. But sales are improving in the condominium market as evidenced in the March Market Report. So those concerns appear to have been addressed and fixed,” added Cindy Carroll of Carroll & Carroll Appraisers and Consultants.
Entry-Level Returns
“We witnessed a high volume of price adjustments over the past year for condos and this has opened a door for entry-level home buyers again,” said Sherry Stein, CRB, Managing Broker, Berkshire Hathaway HomeServices Florida Realty. “Buyers who once thought they were priced out during COVID are now able to enjoy the benefits of a natural market correction, and our March condominium sales reflect this renewed opportunity.”
Several brokers reviewing the March Housing Market Report remarked that the current mix of inventory provides ample choices across all price categories. The report also showed single-family homes in the $500,000 – $1.5 million price category command the highest inventory level compared to all other price categories reported.
“New listings are down slightly [14.1 percent/ytd], and this has put a governor on our inventory. That may be because some potential sellers are staying in their homes longer, especially since many locked in low interest rates before the rate rise began in 2022,” said Hughes.
Overall inventory decreased 17.5 percent to 6,367 properties from 7,722 properties in March 2025. However, sellers appear more competitive in the condominium market, which had an 18.5 percent increase in inventory for properties in the $300,000 and below price category during March.
“There are 19 insurers in Florida now,” said Jones. “And many, including Citizens, committed to lower their rate increase this year. Along with the price corrections and more competitive entry-level condominium market, buyers are finding added reprieve in the expanded and competitive insurance market too.”
The NABOR® March 2026 Market Report provides comparisons of single-family home and condominium sales (via the Southwest Florida MLS), price ranges, and geographic segmentation and includes an overall market summary. NABOR® sales statistics are presented in chart format, including these overall (single-family and condominium) findings for 2026: |
|
| Leading the Trend
According to Budge Huskey, CEO, Premier Sotheby’s International Realty, “We are not seeing the same sales results across Florida. Sarasota is half the pace of Naples. Tampa and Orlando sales are flat. The Naples market has characteristics not found elsewhere. So, whether sales are driven by lifestyle or location, the Naples market continues to outpace other luxury markets in Florida.”Stein added, “The market has spoken: Sales improve when the prices are right. For this to finally occur, buyers and sellers can thank the REALTOR® community because they have been steadfast in educating their clients on market comparisons and getting them to either lower the list price or negotiate for a price that makes sense in today’s market. The price corrections we started seeing last summer have created a healthier market for both buyers and sellers today.” |
|
| If you are considering buying or selling your home, look to a Naples REALTOR® who has the ability to provide an accurate market comparison and give you expert advice on how to capitalize on today’s market conditions. A REALTOR® can ensure your next purchase or sale in the Naples area is a success. Search for your dream home and find a Naples REALTOR® on Naplesarea.com. |
|
|
Why Choose Me As Your REALTOR®?
|
To learn more about me and my real estate business and Bonita Bay real estate specifically, I encourage you read the About Ed section as well as the Testimonial section of the site. Over the years, my clients have expressed their satisfaction in my services and I’ve showcased their kind words so you can determine if I am the right REALTOR® to represent you. If you are curious as to my sales success, visit my Sold Homes page. This gives a clear picture of exactly what I’ve accomplished and, more importantly, what I can accomplish for you.
|
|
|
|